【Survey on Water Server Usage Frequency and Rate of MyBottle Users (FY2023)】was conducted
- Sophia School Corporation
- Student Staffs
Office of Sophia Sustainability Promotion has installed water servers on campus since 2021 to promote equal access to safe water and de-plasticization through the use of “My Bottle” to achieve SDG 6, 12, 13, and 14. The Office of Sophia Sustainability Promotion conducted a survey to understand the current status of water servers, to promote the use of “My Bottle” and to improve the management of water servers in the future.
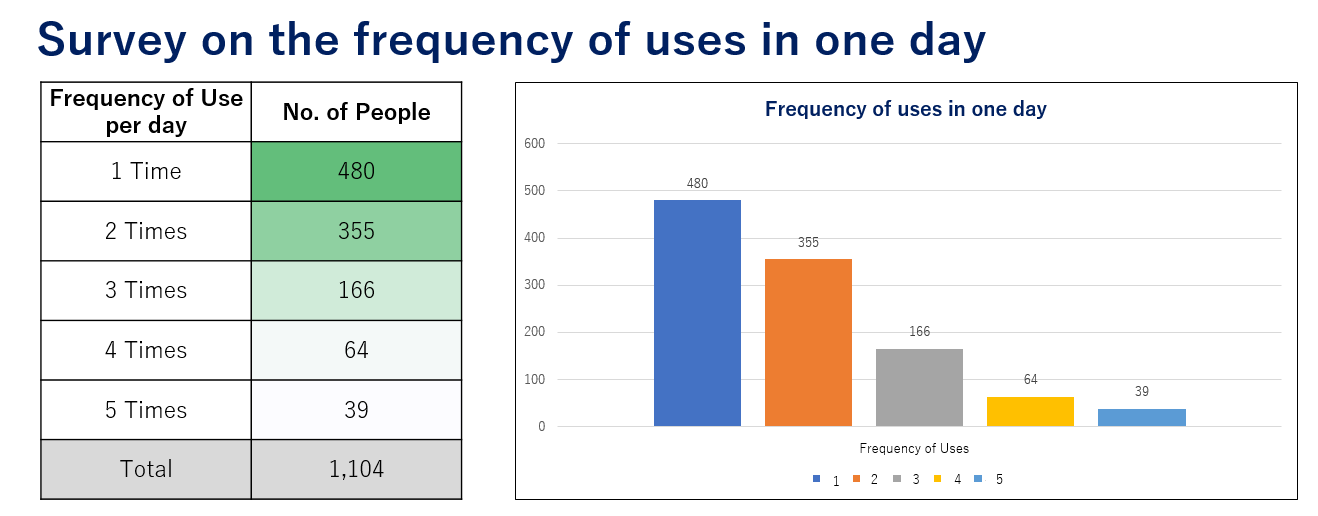
● Number of times used per day
From June 12 (Mon.) to June 16 (Fri.), from 12:30 to 13:30, 1,104 students who used the water servers in the central area of Building No. 2 and pilotis of Building No. 11 – where the number of users was expected to be highest, were asked about the number of times they used the water server daily.
The majority of students, 480, indicate they use the water server once a day, followed by 355 students who uses it twice a day, and 166 who uses it three times a day.
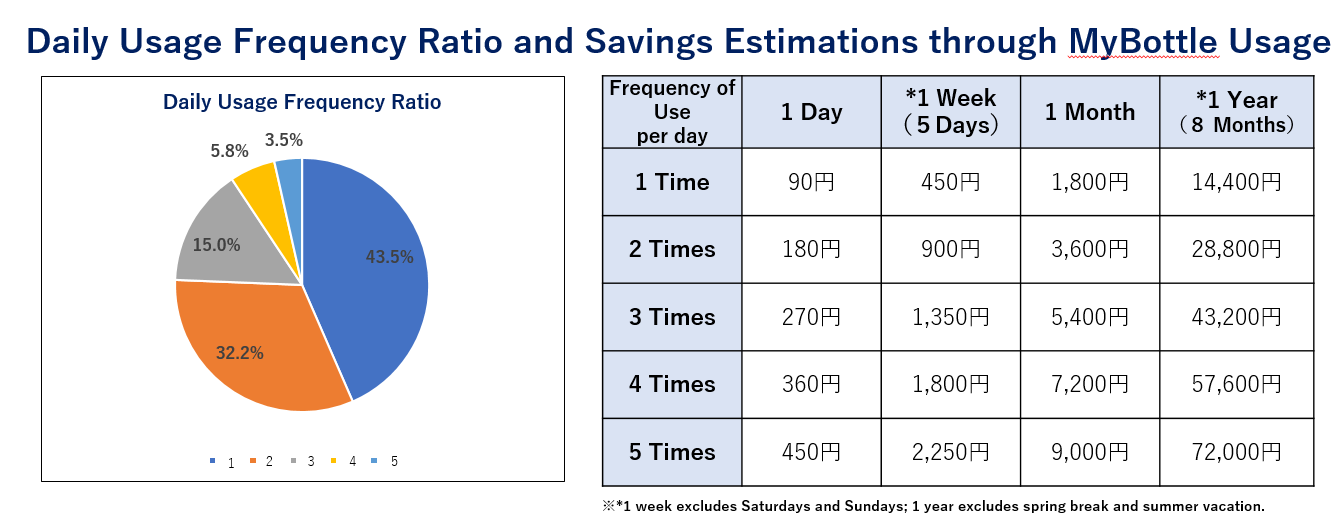
● Daily Usage Frequency Ratio and Savings Estimations through MyBottle Usage
Looking at the percentages, 43.5% of the students drink water once a day, 32.2% twice a day, and 24.3% three or more times a day. Assuming that students who bring their own water bottles can save the cost of purchasing a bottled water (90 yen) per water refill, simple calculations show the students who use the water server once per day can save 90 yen a day, 450 yen a week, 1,800 yen a month, or 14,400 yen a year.
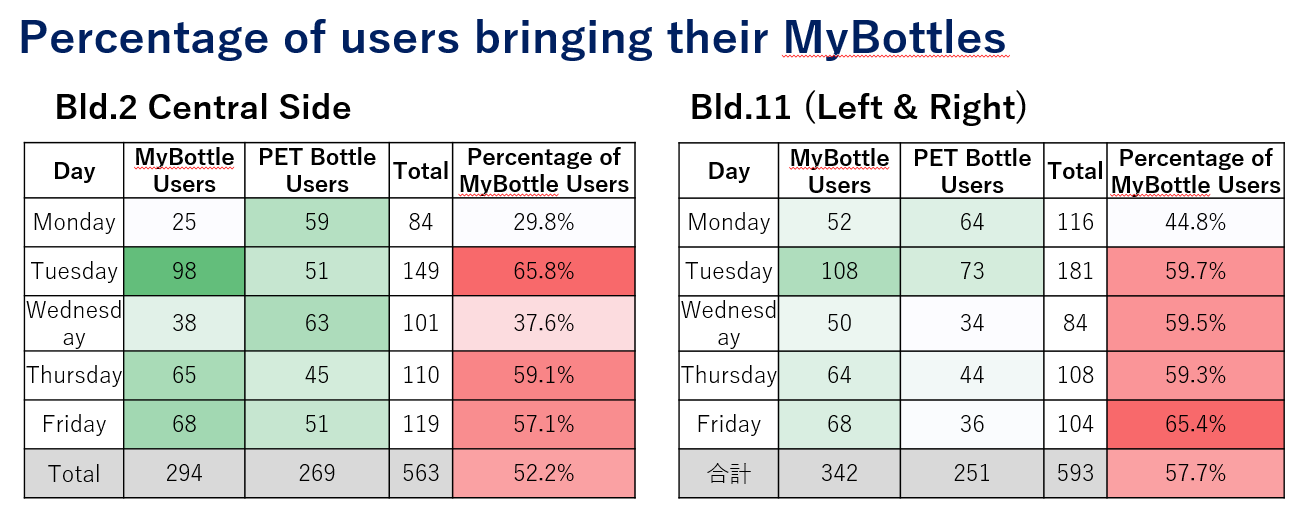
● Percentage of users bringing their MyBottles
From June 12 (Mon.) to June 16 (Fri.), from 12:30 to 13:30, 1,104 students who used the water servers in the central area of Building No. 2 and pilotis of Building No. 11 – where the number of users was expected to be highest, were measured about the number of people who uses their own water bottle.
On most days of the week, more than 50% of the respondents used their MyBottles. Other days, the number of users refilled with empty bottles (repeated use), which is thought to be contributing to the reduction of plastic bottle waste.
【Report on the “Survey on Water Server Usage Frequency and Rate of MyBottle Users” (FY2023)】